睡眠对认知和维持大脑健康功能都至关重要。神经活动中的慢波有助于记忆巩固,而脑脊液(CSF)清除大脑中的代谢废物。这两个过程是否相关尚不清楚。我们使用加速神经成像来测量人脑的生理和神经动力学。我们发现在非快速眼动睡眠中出现了振荡电生理、血液动力学和 CSF 动力学的连贯模式。神经慢波伴随着血液动力学振荡,而血液动力学振荡又与 CSF 流耦合。这些结果表明,睡眠的大脑在宏观尺度上表现出脑脊液流动的波动,这些脑脊液动力学与神经和血液动力学节律是相互联系的。睡眠对于高级认知处理以及生理功能的基本维持和恢复都至关重要。在人类非快速眼动(NREM)睡眠期间,脑电图(EEG)表现出低频(<4 Hz)振荡动力学,支持记忆和神经计算。此外,测量血氧水平依赖(BOLD)信号的功能磁共振成像(fMRI)研究表明,在 NREM 睡眠期间,血液动力学发生了广泛变化。睡眠还与间质液体积增加和代谢废物进入CSF的清除率有关,并且在睡眠中清除率更强,更多低频 EEG 振荡。为什么这些不同的生理过程在这种低唤醒状态下同时发生尚不清楚。特别是,目前尚不清楚睡眠期间 CSF 动力学是如何变化的,以及它们与神经活动和血流动力学的主要变化之间的关系。
我们同时测量了人类睡眠期间的 BOLD fMRI 动力学、EEG 和 CSF 流动。为了实现高时间分辨率成像,我们以快速的速率[重复时间(TR)< 400毫秒]采集了 fMRI 数据。虽然 fMRI 通常用于检测局部氧合变化,但快速采集模式也能够检测流体流入:到达成像体积边缘的新鲜流体具有高信号强度,因为它尚未经历射频脉冲(fig. S1)。通过将成像体积的边界边缘放置在第四脑室(Fig.1A),进入大脑的 CSF 流动在较低层面中被检测为增加的信号(Fig.1B),使我们能够与 BOLD fMRI 同时测量 CSF 流动的动力学。我们将这一成像与同时进行的 EEG(n =13 名被试)相结合,并确定了具有低运动的清晰稳定觉醒或 NREM 睡眠的连续片段(fig. S2 and materials and methods),以能够分析连续低频动力学。
 Fig. 1. Large oscillations in CSF signals appear in the fourth ventricle during sleep. (A) Example scan positioning. Thick yellow line: position of the functional image relative to the anatomy. The bottom edge intersects with the fourth ventricle (red arrow), allowing CSF inflow to be measured. A subset of the 40 acquired slices are displayed. (B) Example functional image from the bottom slice. Inflow through the ventricle is detected as a bright signal (red arrow). (C) EEG spectrogram from this individual shows long periods of NREM sleep and wake (~10 Hz occipital alpha). (D) Behavioral responses from this individual. (E) Time series of a single CSF voxel (smoothed with 10-TR kernel) shows large, slow dynamics in sleep that subside during wakefulness. (F) Mean power spectral density (PSD) of occipital EEG confirms slow-delta power in sleep, as opposed to high alpha power in wake (n = 13 participants sleep; 11 participants wake). (G) PSD of CSF signal shows increased 0.05 Hz power during sleep (n = 13 participants sleep; 11 participants wake). Shaded regions denote 95% CIs; red lines and asterisks mark nonoverlapping CIs. (H) Low-frequency (LF, 0 to 0.1 Hz) CSF power increased during sleep (n = 11 participants for pairwise comparison). a.u., arbitrary units. (I) This sleep-selective power increase was specific to the ventricle ROI and not observed in a neighboring size-matched control ROI (n = 11 participants).
我们首先研究了睡眠是否与不同的脑脊液流动动力学相关(Fig. 1, C to E)。在清醒期间,CSF 信号在约 0.25 Hz 时表现出与呼吸信号同步的小幅度节律(Fig. 1, E and G),与先前的研究一致。相反,在 NREM 睡眠期间,我们观察到在 0.05 Hz CSF 信号中有很大的振荡(Fig. 1, E and G)。我们分析了所有睡眠段的 CSF 信号,证实所识别的睡眠段表现出 NREM 睡眠的低频 EEG 特征(Fig. 1F)。我们发现,在睡眠期间,CSF 信号增加 5.52 dB,峰值为0.05 Hz(Fig. 1, G and H, and fig. S2)[95% 置信区间(CI)=(2.33,7.67);P=0.003,signed-rank 检验],这表明大约每 20 秒就会出现一次大的 CSF 流入波。我们还分析了具有匹配层面定位的附近非 CSF感兴趣区(ROI),没有发现这种效应[变化=−0.03 dB,CI=(−2.7,1.3);统计差异 P=0.003,signed-rank 检验],表明这种睡眠相关模式是由脑室中的生理信号特异性驱动的(Fig.1I)。因为流入信号是由流入采集体积的流体引起的,所以 CSF 流量信号在边缘层面中应该最亮,并且随着流体进入中心层面而衰减(Fig. 2,A and B, and fig. S1)。我们确实在层面上观察到了信号振幅的梯度(Fig. 2, C and D)。一些大的流入事件在较低的层面上表现出同样明亮的振幅(Fig.2D),表明 CSF 流速已经超过成像临界速度(层面 2 为 11.4 mm/s)。总之,这些结果确定了在 NREM 睡眠期间出现的 0.05Hz CSF 的大幅度脉动流。 Fig. 2. Ventricle signals correspond to a ~0.05-Hz pulsatile inflow of CSF. (A) Schematic of acquisition. New CSF flowing into the imaging volume will generate bright signals. (B) Inflow signals will be largest in the bottom slice and decrease in amplitude inwards. If flow exceeds the critical velocity, then CSF in the bottom slice is completely replaced, and signal amplitudes are large in inner slices as well. (C) Mean amplitude across slices decays in ascending slices. Error bars are standard error across all sleep segments, with the ROI present in four contiguous slices (n = 129 segments, 11 participants). (D) Example time series from the bottom slices of the imaging volume in the fourth ventricle demonstrates the largest signal in the lower slices (e.g., second) and smaller signals in higher slices (e.g., fourth). Orange arrows schematically illustrate flow velocity (larger arrows denote higher velocity), and black arrows point out individual events.
接下来,我们检查了这些缓慢的宏观 CSF 振荡是否与血液动力学信号相关。先前的研究提出,与~1Hz 心动周期相对应的微动脉搏动是驱动间质液流动的机制。为了测试可能产生我们观察到的慢得多的宏观 CSF 节律的原因,我们分析了睡眠期间 BOLD 信号的变化。与清醒时相比,我们观察到睡眠期间皮质灰质 fMRI 信号中的 BOLD 信号幅度增加(Fig. 3A versus B and C)[平均值=3.28 dB;CI=(0.09,6.54);P=0.032,signed-rank 检验],与之前关于睡眠期间低频 BOLD 波动的报告一致。此外,在睡眠期间,CSF 信号在时间上与皮层灰质 BOLD 振荡紧密耦合(Fig. 3, A and B),表现出强烈的反相关性(fig. S3)(滞后 2s 时最大 r=−0.48,P<0.001)。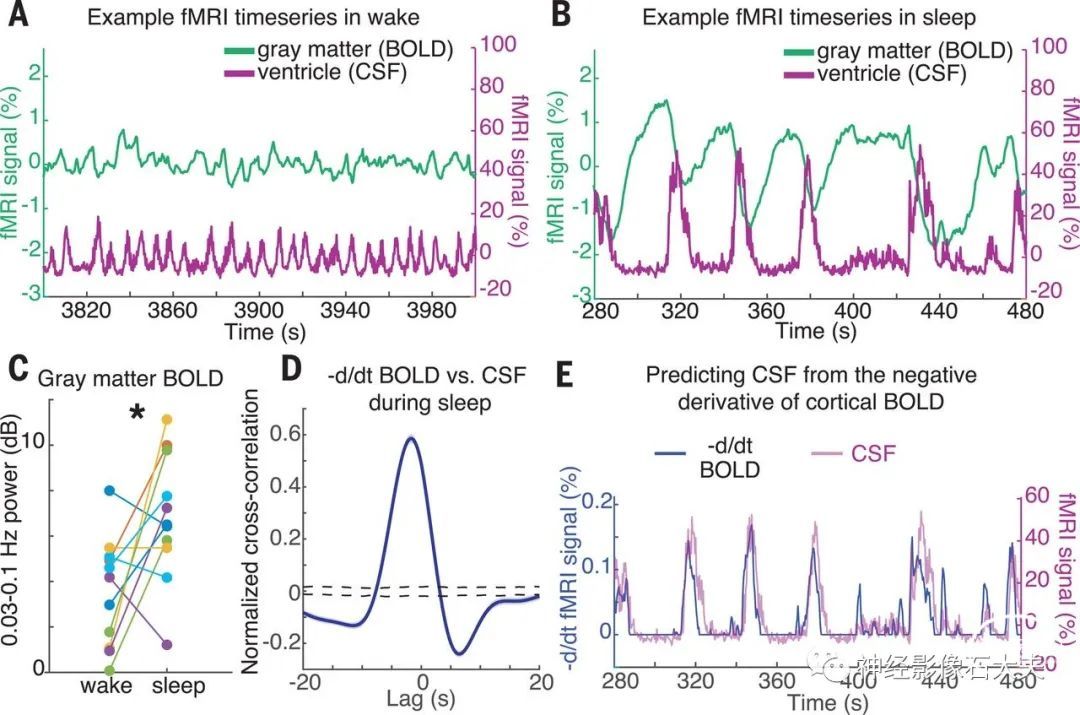
Fig. 3. CSF flow oscillations are anticorrelated to a hemodynamic oscillation in the cortical gray matter that appears during sleep, with CSF flow increasing when blood volume decreases. (A) Example time series of the cortical gray-matter BOLD signal and the mean CSF signal from one participant. During wake, signals are low-amplitude and synchronized to respiration (0.25 Hz). (B) During sleep, a large-amplitude BOLD oscillation appears, and its time course is coupled to the ventricle CSF signal (~0.05 Hz). (C) Mean cortical gray-matter BOLD signal power increases during sleep (n = 11 participants for pairwise test). (D) Mean cross-correlation between the zero-thresholded negative derivative of BOLD and CSF signals shows strong correlation (n = 176 segments, 13 participants). The shaded blue region indicates the standard error across segments; the black dashed line denotes the 95% interval of shuffled distribution. (E) Example time series showing the correlation, suggesting that CSF flows up the fourth ventricle when cerebral blood volume decreases.
 Fig. S3: Correlation between cortical BOLD and CSF signals. The BOLD signal is significantly anticorrelated with the CSF signal. Shaded region is standard error across segments and black dashed lines are 95% intervals of shuffled data.
这种反相关性提示睡眠期间血液流动和脑脊液流动可能改变。我们假设 BOLD 振荡对应于脑血容量的振荡,并且由于颅内容量恒定,当血液占据较少的体积时,更多的 CSF 流入头部。该假设预测,在将负值设置为零(materials and methods)后,CSF 信号应近似匹配 BOLD 振荡的负导数。与这一假设一致,CSF 时间序列和阈值导数 BOLD 信号强相关(Fig. 3,D and E)(滞后 -1.8 s 时最大 r=0.59;P<0.001)。
接下来,我们研究了睡眠期间神经活动是否与这些耦合的血液动力学和 CSF 振荡相关。在传统的 fMRI 中,BOLD反应是由神经活动引起的,神经活动驱动富氧血液的流动,EEG 振荡与血液动力学信号相关)。因此,我们假设NREM 睡眠的大而缓慢的 delta(0.2-4 Hz)电生理振荡特征可能与血容量的振荡以及对 CSF 流量的位移效应有关。我们分析了慢 delta EEG 相对于 CSF 波峰值的瞬时振幅,发现神经波、BOLD 波和 CSF 波是耦合的(Fig. 4, A to C, and fig. S4)。神经波先于 CSF 波,慢 delta EEG 中的峰值出现在 CSF 峰值前 6.4s(峰值振幅=21%,P<0.001)。我们计算了 EEG 和 CSF 之间的最佳拟合脉冲响应(Fig. 4D),发现将 EEG 与该脉冲响应卷积可以显著预测 CSF 动力学(fig.S5A)(零滞后 r=0.23,交叉验证 r=0.22±0.07)。为了检查这种 EEG-CSF 耦合是否与睡眠期间 CSF 波的出现特异相关,我们测试了 EEG 在具有最大 CSF 波的节段中对CSF动力学的预测效果。在 CSF 波较大的节段中表现更高(fig. S5, B and C)(零滞后r=0.54,P<0.001),这表明在 CSF 波最丰富的睡眠节段中,EEG 与 CSF 的联系更紧密。 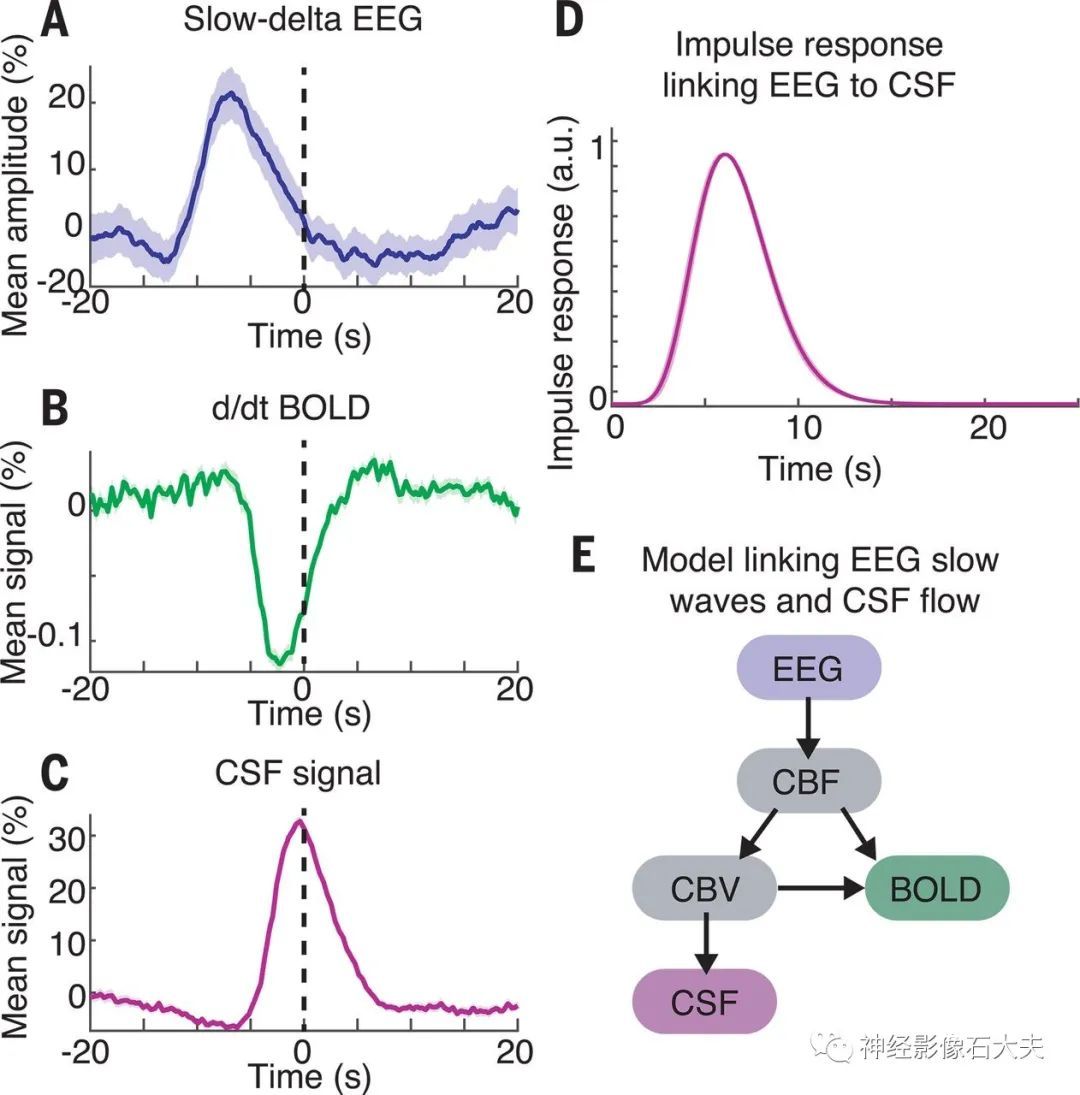
Fig. 4. EEG slow-delta waves are coupled to and precede BOLD and CSF oscillations. (A) Mean amplitude envelope of slow-delta EEG, (B) mean derivative of BOLD signals, and (C) mean CSF signal,all locked to the peaks of CSF waves during sleep. The shaded region represents the standard error across peak-locked trials (n = 123 peaks). (D) Calculated impulse response of the CSF signal to the EEG envelope shows a time course similar to that of previously established hemodynamic models. Shading indicates standard deviation across model folds. (E) Diagram of model linking the time course of neural activity to CSF flow. Variables include CBF and cerebral blood volume (CBV).
 Fig. S5: Best-fit impulse response prediction of CSF using the EEG data. A) The normalized cross-correlation of the CSF signal vs. the prediction of CSF using the EEG data demonstrates successful model prediction of CSF dynamics (p<0.001, n=176 segments, shuffling test). B) When considering only the sleep segments with the largest CSF waves (range>50%, n=19 segments), the model prediction performance is increased, demonstrating that the EEG is more predictive of CSF when larger CSF waves are present (p<0.001, shuffling test). Shaded region is standard error across segments. C) Cross-correlation of CSF data and model-based CSF prediction (using only EEG data) for each individual sleep segment. Segments are sorted by the amplitude of CSF peaks present in each segment (smaller index is smaller CSF waves). Sorting segments by CSF wave amplitude demonstrates that the slow-delta EEG model prediction performs well in individual segments, and that it explains the most variance in the segments with the largest CSF waves.
因此,EEG、BOLD 和 CSF 信号的相干动力学表现出特定的时序,神经节律先于随后的 BOLD 和脑脊液波。为了测试这些观察到的相关性和延迟模式是否可能源于生物物理机制,我们使用已建立的血液动力学耦合模型构建了一个计算模型(Fig. 4E and fig. S6)。我们提取了慢 delta EEG 包络,由于其对神经活动的相关抑制,预计其与脑血流量(CBF)信号的减少相关。然后使用神经振荡来预测血流量、血容量和 CSF 的时间序列。该模型首先使用先前报道的生理参数,没有额外的参数拟合,来测试我们的观察结果是否与这些信号之间建立的生物物理耦合一致。该模型的性能与最佳拟合脉冲响应一样好[零滞后 R=0.22;分段间的 CI=(0.16,0.27);P<0.001](fig. S6 and S7)。在所有滞后中,模型预测显著大于原始 EEG 包络和 CSF 之间的最大相关(最大 r=0.15,P<0.05),这表明我们的数据与神经活动、血流动力学和脑脊液之间的生物物理耦合一致。 Fig. S6: Comparison of models implementing links between neural activity and CSF. Model variables include cerebral blood flow (CBF) and cerebral blood volume (CBV). A) We first implemented a model using previously established parameters without any additional fitting, and a simple assumption for CSF flow: we model the CSF signal as compensating changes in cerebral blood volume, and calculate it as the opposite of the change in CBF. We therefore tested whether the CSF dynamics were well predicted by the EEG-locked changes in CBF, using fixed parameters published in previous studies. This model performed as well as the best-fit impulse response, indicating that these biophysical mechanisms would produce the time-lagged dynamics we observe. B) We then allowed parameter settings to vary, finding two parameter settings that predicted the best-fit impulse response mapping EEG to the CSF signal, displayed in Fig. S7. In this case, we optimized model parameters to produce a CSF signal that was opposite to the d/dt of the CBV signal (i.e., positive CSF signal corresponding to negative d/dt CBV).
 Fig. S7: The best fit impulse response for the CSF dynamics is consistent with a biophysical model of cerebral blood volume dynamics. The numerically fit CSF impulse response shows a similar, but slightly slower waveform, as compared to the fixed-parameter CBF impulse response. In this figure we demonstrate two model scenarios that are consistent with this CSF impulse response. First, this impulse response timing is within the established physiological range for CBF responses, so this result would be consistent with a slightly slower CBF coupling to spontaneous slow-delta EEG in sleep (as compared to task-induced fMRI measurements). Alternatively, it could reflect delayed changes in blood volume relative to blood flow. A) Implementation of delayed CBF scenario: the CBF impulse response timing matches the empirical CSF impulse response, corresponding to a slightly slower but still physiological blood flow response, as compared to the fixed-parameter model. B) Implementation of the delayed CBV scenario: plotting impulse response of the best-fit CBV impulse response (green) when holding the CBF impulse response constant at the fixed parameters, using a viscoelastic time constant of 30 s. This time constant provided the best fit within the physiological range of [0 30] s. The responses of modeled blood flow (yellow) and CSF data (purple) are also shown for comparison.
 Fig. S9: Flowchart of preprocessing steps on each data type used in crosscorrelation analyses. After preprocessing and filtering, pairs of signals were compared using cross-correlation analyses (Fig. 3d, Fig. S3, Fig. S4). For comparison, the crosscorrelation without filtering is displayed in Fig. S10.我们得出的结论是,人类睡眠与神经元活动、血氧和脑脊液流动的大耦合低频振荡有关。尽管电生理慢波已知在认知中起着重要作用,但我们的研究结果表明,它们也可能与睡眠的生理恢复作用有关,因为缓慢的神经活动之后是全脑血容量和脑脊液流量的脉动。这些结果解决了睡眠神经生理学中一个关键的缺失环节。我们确定的 CSF 流动的宏观变化预计会改变废物清除率,因为脉动流体动力学会增加混合和扩散。神经-血管耦合被认为有助于清除,但为什么它会在睡眠期间导致更高的清除率尚不清楚。我们的研究表明,缓慢的神经和血液动力学振荡可能与其他生理因素共同导致了这一过程。接下来,对动物的研究可能会测试这些神经和生理节律之间的因果关系。
我们对睡眠相关 CSF 流体动力学的确定也表明,在与睡眠障碍相关的临床条件下,其是一种有待探索潜在的生物标志物。老化中的记忆障碍与慢波被抑制相关;我们的模型表明,这种慢波损失反过来又与 CSF 流动减少有关。此外,我们的研究结果暗示了最近的发现之间的潜在桥梁,即 tau CSF 水平和淀粉样蛋白β依赖于睡眠和神经活动,而振荡神经活动导致 tau 减少——相干神经活动可能预示着更高的蛋白质聚集清除率。总之,我们的研究结果确定了睡眠期间出现的脑脊液流动波,并表明神经活动的缓慢节律与这些脑脊液波是相互联系的,血液动力学振荡是这些过程耦合的中间机制。